Merger brought new experts to Hansel
Number of personnel
|
2019 |
2018 |
2017 |
2016 |
2015 |
| Number of personnel at the end of financial period (person-years) |
113 |
92 |
90 |
72 |
74 |
| Average number of personnel during the financial period (person-years) |
101 |
90 |
83 |
73 |
73 |
| Valid employment contracts on 31 December |
116 |
95 |
94 |
75 |
76 |
| Valid permanent employment contracts on 31 December |
115 |
94 |
90 |
75 |
74 |
| Valid fixed-term employment contracts on 31 December |
1 |
1 |
4 |
0 |
2 |
| Full-time fixed-term employment contracts on 31 December |
1 |
0 |
3 |
0 |
0 |
| Part-time fixed-term employment contracts on 31 December |
0 |
1 |
1 |
0 |
2 |
| Full-time employment contracts (fixed-term and permanent) on 31 December |
114 |
92 |
91 |
73 |
74 |
| Maternity/child-care leave on average |
1 |
3 |
2 |
1 |
1 |
| Permanent employment contracts on 31 December, % |
99.1 |
98.9 |
95.7 |
100.0 |
97.4 |
| Fixed-term employment contracts on 31 December, % |
0.9 |
1.1 |
4.3 |
0.0 |
2.6 |
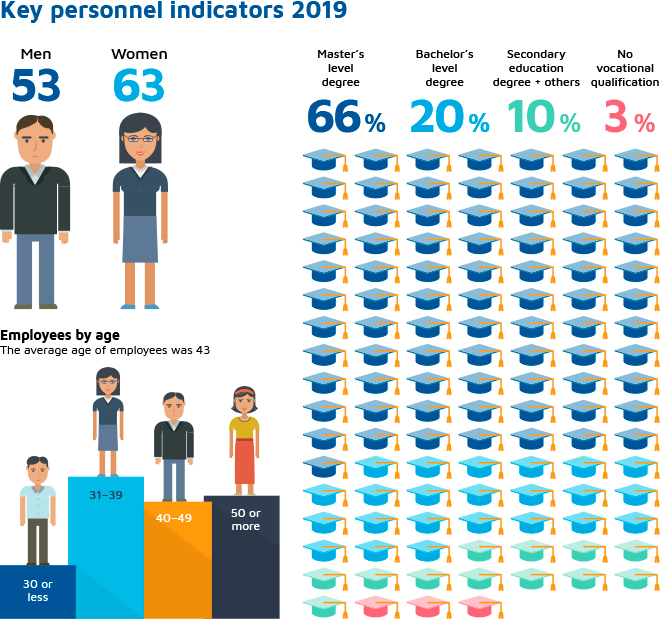
Employees by gender
|
2019 |
2018 |
2017 |
2016 |
2015 |
| Male |
53 |
43 |
45 |
36 |
38 |
| Female |
63 |
52 |
49 |
39 |
38 |
Average duration of employment
| Years of service |
2019 |
2018 |
2017 |
2016 |
2015 |
| 40 or more |
1 |
2 |
2 |
2 |
2 |
| 30–39 |
3 |
3 |
3 |
3 |
3 |
| 20-29 |
0 |
0 |
0 |
0 |
0 |
| 10-19 |
28 |
23 |
21 |
16 |
15 |
| 4-9 |
30 |
25 |
26 |
31 |
32 |
| 1-3 |
43 |
33 |
15 |
14 |
19 |
| Less than a year |
11 |
9 |
27 |
9 |
5 |
| Number of employees total |
116 |
95 |
94 |
75 |
76 |
Employees by age
Personnel turnover
|
2019 |
2018 |
2017 |
2016 |
2015 |
| New employment contracts* |
33 |
12 |
28 |
10 |
8 |
| of which fixed-term contracts |
3 |
3 |
5 |
1 |
5 |
| Terminated employment contracts |
10 |
9 |
10 |
11 |
11 |
| of which retired |
2 |
0 |
1 |
0 |
3 |
| Terminations of fixed-term employment contracts |
1 |
4 |
1 |
2 |
4 |
| Terminations during trial period |
1 |
0 |
0 |
0 |
0 |
| Resignations |
6 |
5 |
8 |
9 |
3 |
| Dismissals |
0 |
0 |
0 |
0 |
1 |
| Average turnover, % |
18.5 |
11.1 |
20.2 |
14.0 |
12.5 |
| Exit rate, % |
8.6 |
9.5 |
10.6 |
14.7 |
14.5 |
| Exit rate, resigned employees, % |
5.2 |
5.3 |
8.5 |
12.0 |
3.9 |
| * New employment contracts include 16 former employees of KL-Kuntahankinnat who became Hansel’s existing employees due to the merger on 2 September 2019. |
New employees
| Male |
Female |
30 years of less |
31–39 y |
40-49 y |
50-59 y |
More than 60 years |
| 42 % |
58 % |
24 % |
39 % |
18 % |
15 % |
3 % |
Sick leave and accidents
|
2019 |
2018 |
2017 |
2016 |
2015 |
| Number of accidents leading to sick leave annually |
1 |
2 |
2 |
5 |
4 |
| Number of accidents during working hours annually |
0 |
2 |
2 |
1 |
1 |
| Fatalities |
0 |
0 |
0 |
0 |
0 |
| Sick leaves, including caring for a sick child (days per person-year) |
4.3 |
2.2 |
3.5 |
6.1 |
9.7 |
| Sick leaves, excluding caring for a sick child (days per person-year) |
3.9 |
1.8 |
3.1 |
5.0 |
8.6 |
| Short-term sick leaves (1–3 days), excluding caring for a sick child (days per person-year) |
2.9 |
1.8 |
2.1 |
2.6 |
3.0 |
| Sick leaves total, excluding caring for a sick child (person-years) |
1.7 |
0.7 |
1.1 |
1.6 |
2.7 |
| Sick leave rate, including caring for a sick child (%) |
1.8 |
1.0 |
1.5 |
2.6 |
4.1 |
| Sick leave rate, excluding caring for a sick child (%) |
1.6 |
0.8 |
1.3 |
2.1 |
3.6 |
| Health care expenses (€/person/year) |
582 |
305 |
351 |
465 |
657 |
| Personnel recreation expenses (€/person/year) |
296 |
407 |
260 |
397 |
314 |
Degrees
|
2019 |
2018 |
2017 |
2016 |
2015 |
| Master’s level degree, % |
59 |
61 |
61 |
61 |
63 |
| Bachelor’s level degree, % |
5 |
5 |
7 |
7 |
5 |
| Master’s degree from a university of applied sciences, %* |
7 |
5 |
3 |
0 |
0 |
| Bachelor’s degree from a university of applied sciences, % |
15 |
14 |
11 |
12 |
12 |
| Secondary education degree + other degrees, % |
10 |
10 |
13 |
13 |
15 |
| No vocational qualification, % |
3 |
5 |
5 |
7 |
5 |
Education
|
2019 |
2018 |
2017 |
2016 |
2015 |
| Training days (days/person/year)** |
3 |
3 |
5 |
5 |
5 |
| Training days (days/person/year), supervisors |
3 |
5 |
8 |
6 |
9 |
| Training days (days/person/year), others |
3 |
3 |
4 |
4 |
4 |
| Training days (days/person/year), female |
2 |
3 |
5 |
4 |
5 |
| Training days (days/person/year), male |
3 |
3 |
4 |
5 |
5 |
| Training services purchased from third parties (€/person/year) |
644 |
1,085 |
1,622 |
1,196 |
1,339 |
| * Master’s degree from a university of applied sciences was added as of 2017; no distinction was made between degrees from universities and universities of applied sciences before that. |
| ** As of 2017, training days have been divided with the average number of employees (work input); previously full-time employment relationships on 31 December. |
Paid incentives (excluding social insurance payments)
|
2019 |
2018 |
2017 |
2016 |
2015 |
| EUR thousand |
722 |
660 |
511 |
551 |
505 |